AI tool · A1
Batch processing of simulation results and thermal resistance
Reads a batch of thermal simulation table exports, computes junction-to-coolant thermal resistance and its split by layer, flags faulty rows, compares designs and cooling conditions, and writes tables, figures and a report.
Self-initiated project · Public demonstration made in October 2026 · Sample data generated from a generic model on this site; no employer data
Division of workI defined the method and requirements and checked the results; the code was implemented with AI coding tools and reviewed by me. This case is a public demonstration made in October 2026 with a generic model and self-generated data; similar tools I use at work are confidential and not published.
Python tool, measured run (sample data)
- Export files
- 3
- Data rows
- 38
- Valid cases
- 36
- Rows flagged
- 2
- Parse, compute and check
- 1.4ms
Numbers from output/run.json in the repository, the record of one actual run in the sandbox; the figures and report took a further 0.44 s.
Processing steps
Export files
One text table per design from a parametric sweep: % header lines and column names, then rows of numbers.
Parse
Reads the design name and description from the header; finds h, P, coolant temperature and Tj,max by column aliases and converts units (K → °C, kW → W).
Compute and check
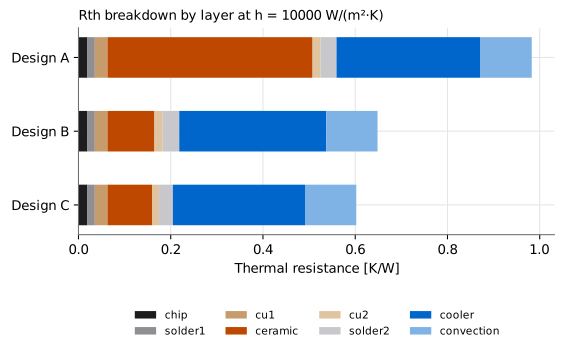
Rth = (Tj,max − T_cool) / P, split by layer when layer bottom temperatures are exported. Checks for non-numeric values, Rth ≤ 0, the layer sum, Tj rising with P at the same h, Rth outliers and the junction limit.
Compare
Ranks designs by mean Rth at each h with the difference to the best; computes the Rth change and dRth/d(ln h) between adjacent h levels.
Figures and report
Writes four CSV files (summary, flagged, comparison, sensitivity), three SVG figures and a Markdown report.
Run it in the browser
The page carries the three sample export files (designs A, B and C, 38 rows, two of them deliberately faulty). Run repeats the Python tool’s parsing, calculation and checks in TypeScript in your browser.
Local files are read and processed in your browser only and are not uploaded. See Limitations below and the README for the format.
Sample filesdesign-A_al2o3-0.38mm.txtdesign-B_si3n4-0.32mm.txtdesign-C_aln-0.63mm.txt
Python tool
A command-line tool in tools/sim-batch-rth: batch_rth.py parses, computes, checks and compares with the Python standard library only; run_batch.py draws the figures with matplotlib and writes the report. pytest unit tests and a pinned requirements.txt are included.
| Export files | 3 |
|---|---|
| Rows read | 38 |
| Valid / flagged / junction warnings | 36 / 2 / 6 |
| Parse, compute and check | 0.0014 s |
| Figures and report | 0.444 s |
| Whole script (including the matplotlib import) | 0.794 s |
| Environment | Python 3.13.16 · matplotlib 3.11.2 |
Tool folder on GitHubGenerated report
Core functions
parse_export: header lines and column names
def split_name_unit(label: str) -> tuple[str, str]:
    """'h (W/(m^2*K))' -> ('h', 'W/(m^2*K)'); nested parentheses in the unit are kept."""
    label = label.strip()
    if not label.endswith(")"):
        return label, ""
    depth = 0
    for index in range(len(label) - 1, -1, -1):
        depth += {")": 1, "(": -1}.get(label[index], 0)
        if depth == 0:
            return label[:index].strip(), label[index + 1:-1].strip()
    return label, ""


@dataclass
class Export:
    file: str
    design: str
    meta: dict[str, str]
    columns: list[tuple[str, str]]
    rows: list[tuple[int, list[str]]]  # (1-based line number, raw cells)


def parse_export(name: str, text: str) -> Export:
    """COMSOL-style table export: '% Key: value' header lines, the last '%' line names the
    columns (separated by two or more spaces or tabs), then whitespace-separated numbers."""
    meta: dict[str, str] = {}
    header_lines: list[str] = []
    rows: list[tuple[int, list[str]]] = []
    last_key = None
    for number, line in enumerate(text.splitlines(), start=1):
        if line.startswith("%"):
            content = line[1:].strip()
            header_lines.append(content)
            match = re.match(r"^([A-Za-z][\w ]*?):\s+(.*)$", content)
            if match and not re.search(r"\s{2,}\S+\s*\(", match[2]):
                last_key = match[1].strip()
                meta[last_key] = match[2].strip()
            elif last_key and content and not re.search(r"\S\s{2,}\S", content):
                meta[last_key] += " " + content
        elif line.strip():
            rows.append((number, line.split()))
    if not header_lines:
        raise ValueError("no '%' header lines")
    columns = [split_name_unit(cell) for cell in re.split(r"\t+|\s{2,}", header_lines[-1]) if cell]
    stem = Path(name).stem
    return Export(file=name, design=meta.get("Design", stem), meta=meta, columns=columns, rows=rows)
cases_from_export: thermal resistance and its layer split
def cases_from_export(export: Export) -> list[Case]:
    """Rth = (Tj_max - T_cool) / P for each row; with T_<layer>_bot probes, each layer's share is
    (T_top - T_bottom) / P, where a layer's top is the bottom of the layer above (chip top = Tj)."""
    cols = export.columns
    index = {role: _find(cols, role) for role in ("h", "power", "t_cool", "tj")}
    layer_columns = [(i, m[1]) for i, (name, _u) in enumerate(cols) if (m := LAYER_PATTERN.match(name))]
    cases = []
    for line, cells in export.rows:
        if len(cells) != len(cols):
            case = Case(export.design, export.file, line, math.nan, math.nan, math.nan, math.nan)
            case.errors.append("column_count")
            cases.append(case)
            continue
        value = lambda i: _number(cells[i])  # noqa: E731
        temperature = lambda i: _to_celsius(value(i), cols[i][1])  # noqa: E731
        case = Case(
            design=export.design, file=export.file, line=line,
            h=value(index["h"]), power=_to_watts(value(index["power"]), cols[index["power"]][1]),
            t_cool=temperature(index["t_cool"]), tj=temperature(index["tj"]),
        )
        case.rth = (case.tj - case.t_cool) / case.power if case.power else math.nan
        top = case.tj
        for column, layer in layer_columns:
            bottom = temperature(column)
            case.layers.append((layer, (top - bottom) / case.power if case.power else math.nan))
            top = bottom
        if layer_columns:
            case.layers.append(("convection", (top - case.t_cool) / case.power if case.power else math.nan))
        cases.append(case)
    return cases
check_cases: physical plausibility checks
def check_cases(cases: list[Case], tj_limit: float = TJ_LIMIT_C, rth_tolerance: float = RTH_TOLERANCE) -> None:
    """Row checks first; group checks (same design and h) only among rows that passed them.
    Errors exclude a row from the comparison; warnings keep it."""
    for case in cases:
        if case.errors:
            continue
        numbers = [case.h, case.power, case.t_cool, case.tj, *(r for _n, r in case.layers)]
        if not all(math.isfinite(v) for v in numbers):
            case.errors.append("non_finite")
            continue
        if case.power <= 0 or case.h <= 0:
            case.errors.append("nonpositive_input")
            continue
        if case.rth <= 0:
            case.errors.append("nonpositive_rth")
            continue
        if case.layers and abs(sum(r for _n, r in case.layers) - case.rth) > LAYER_SUM_TOLERANCE * case.rth:
            case.errors.append("layer_sum")
    groups: dict[tuple[str, float], list[Case]] = {}
    for case in cases:
        if not case.errors:
            groups.setdefault((case.design, case.h), []).append(case)
    for group in groups.values():
        group.sort(key=lambda c: (c.power, c.line))
        for previous, current in zip(group, group[1:]):
            if current.power == previous.power:
                current.errors.append("duplicate")
            elif current.tj <= previous.tj:
                current.errors.append("power_monotonicity")
        median = _median([c.rth for c in group])
        for case in group:
            if abs(case.rth - median) > rth_tolerance * median:
                case.errors.append("rth_outlier")
    for case in cases:
        if not case.errors and case.tj > tj_limit:
            case.warnings.append("tj_limit")
compare / sensitivity: design ranking and sensitivity to h
def compare(cases: list[Case]) -> list[Comparison]:
    """Mean Rth per design and h over valid power steps; rank 1 = lowest Rth at that h."""
    groups: dict[tuple[str, float], list[float]] = {}
    for case in cases:
        if not case.errors:
            groups.setdefault((case.design, case.h), []).append(case.rth)
    rows = [
        Comparison(design, h, len(values), sum(values) / len(values),
                   (max(values) - min(values)) / (sum(values) / len(values)))
        for (design, h), values in sorted(groups.items(), key=lambda item: (item[0][1], item[0][0]))
    ]
    for h in sorted({row.h for row in rows}):
        same_h = sorted((row for row in rows if row.h == h), key=lambda row: (row.rth, row.design))
        for rank, row in enumerate(same_h, start=1):
            row.rank = rank
            row.delta_vs_best = row.rth / same_h[0].rth - 1
    return sorted(rows, key=lambda row: (row.design, row.h))


def sensitivity(rows: list[Comparison]) -> list[dict]:
    """Change in Rth between successive h levels, and dRth/d(ln h) in K/W per e-fold of h."""
    result = []
    for design in sorted({row.design for row in rows}):
        series = sorted((row for row in rows if row.design == design), key=lambda row: row.h)
        for low, high in zip(series, series[1:]):
            result.append({
                "design": design, "h_from": low.h, "h_to": high.h,
                "rth_from": low.rth, "rth_to": high.rth,
                "change": high.rth / low.rth - 1,
                "slope": (high.rth - low.rth) / math.log(high.h / low.h),
            })
    return result
Verification
- Browser and Python agree: a unit test runs this page’s TypeScript implementation on the same sample files and requires the summary, flagged, comparison and sensitivity CSV files to be byte-identical to the Python output in the repository.
- Sample data is reproducible: model:lab:verify regenerates the three export files from the S1 analytic resistance network of this site and requires them to be byte-identical to the files in the repository.
- The Python unit tests cover unit conversion, units with nested parentheses, each kind of fault, skipping unreadable files and the two hand calculations below.
Hand checks (design A, h = 10000 W/(m²·K), P = 90 W)
- Convection
R = 1 / (h · A) = 1 / (10000 × 0.030²) = 0.1111 K/WTool output: 0.111111 K/W- Ceramic layer (45° spreading)
R = t / (k · a_in · a_out) = 0.38 mm / (24 × 5.6 mm × 6.36 mm) = 0.4446 K/WTool output: 0.444557 K/W
Limitations
- The sample data come from the S1 analytic resistance network of this site (constant properties, linear), so Rth does not change with power. Real COMSOL results with temperature-dependent properties do; adjust the outlier tolerance (default ±5 %) accordingly.
- The files imitate the text layout of a COMSOL table export but are not COMSOL output. Real exports differ with the version and export settings (separator, column names, units, parameter columns); unrecognized column names must be added to the alias table.
- The layer split needs probe temperatures at each layer bottom (T_<layer>_bot columns); with Tj,max alone only the total Rth is computed. Steady-state scalar results only: no transient Zth curves or field data.
- No employer data is involved; similar tools I use at work are confidential and not published.