S3 · SIMULATION
Pin-fin cold plate
Thermal resistance and pressure drop from tube-bank correlations
Thermal resistance Rth
K/W
Base top surface → coolant inlet
- Pressure drop Δp
- kPa
- Mean heat-transfer coefficient h̄
- W/(m²·K)
- Reynolds number at V_max
- Flow regime
All inputs lie within the correlation rangesValidity ranges
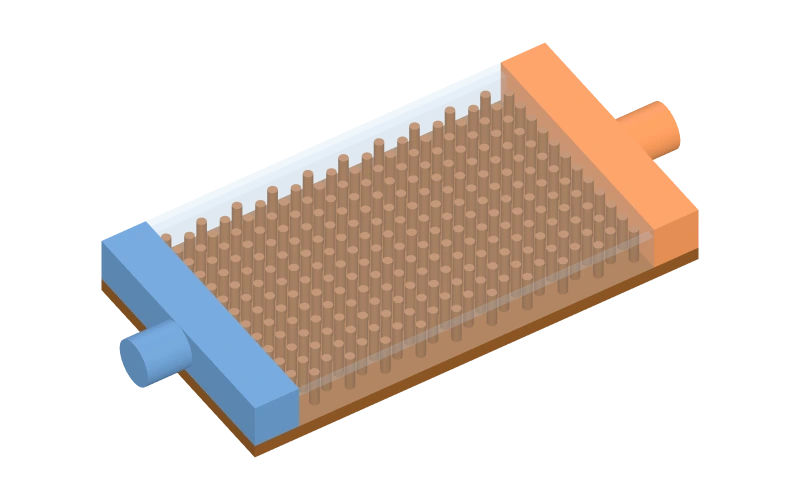 Parametric illustrative model, simplified geometry
Preparing the 3D model
Drag / arrows to orbit · Scroll / +/- to zoom · Home to reset · Click to selectDrag to rotate · Pinch to zoom · Tap a part to select
The static preview is active; calculations, the streamline sketch and the trade-off chart still follow the parameters.
Streamline sketch · top view
Illustrative, not CFDR_th – Δp trade-off
Recalculated across the full slider range of the selected parameter, others held at their current values. Hollow points have at least one correlation outside its range.
Current: Flow rate 8.0 L/min · Rth 0.00773 K/W · Δp 2.14 kPa
Show data table
| Flow rate (L/min) | Rth (K/W) | Δp (kPa) |
|---|---|---|
| 2 | 0.0186 | 0.121 |
| 2.75 | 0.0158 | 0.236 |
| 3.5 | 0.0141 | 0.393 |
| 4.25 | 0.0107 | 0.591 |
| 5 | 0.00983 | 0.828 |
| 5.75 | 0.00915 | 1.10 |
| 6.5 | 0.00859 | 1.42 |
| 7.25 | 0.00813 | 1.76 |
| 8 | 0.00773 | 2.14 |
| 8.75 | 0.00739 | 2.55 |
| 9.5 | 0.00710 | 2.98 |
| 10.25 | 0.00684 | 3.45 |
| 11 | 0.00660 | 3.94 |
| 11.75 | 0.00639 | 4.46 |
| 12.5 | 0.00620 | 5.00 |
| 13.25 | 0.00603 | 5.56 |
| 14 | 0.00587 | 6.15 |
| 14.75 | 0.00572 | 6.76 |
| 15.5 | 0.00558 | 7.40 |
| 16.25 | 0.00546 | 8.05 |
| 17 | 0.00534 | 8.73 |
| 17.75 | 0.00523 | 9.42 |
| 18.5 | 0.00512 | 10.1 |
| 19.25 | 0.00503 | 10.9 |
| 20 | 0.00493 | 11.6 |
Calculation details
- Pins
- 240
- Rows N_L × per row
- 20 × 12
- Wetted area (pins + base)
- 12,064 + 3,246 mm²
- Narrowest-section velocity V_max
- 0.67 m/s
- Nu_D
- 57.7
- C₁ · C₂
- 0.350 · 1.000
- Fin efficiency η_f
- 0.404
- Overall surface efficiency η_o
- 0.530
- NTU · ε
- 0.27 · 0.234
- Convective 1/(η_o hA)
- 0.00679 K/W
- Coolant-rise resistance
- 0.000945 K/W
- Outlet temperature
- 40.72 °C
- ξ · main resistances N_W
- 0.485 · 20
- Bulk properties ρ · c_p · k · μ · Pr
- 992 · 4180 · 0.629 · 0.648 mPa·s · 4.31
- Pumping power
- 0.285 W
- Base temperature @ Q
- 43.1 °C
Explore parameters
Volumetric flow. Heat load only sets the outlet and wall temperatures (Pr_s correction); its effect on resistance is small.
Pitches are multiples of the pin diameter: transverse S_T across the flow, longitudinal S_L along it. Pin height equals the channel height.
The array is centred in length × width; the coolant flows along the length.
These parameters could not be evaluated. Check the values or restore the defaults.
Not even one row of pins fits. Enlarge the base or reduce the pitch.
Correlation validity
Every calculation checks whether the inputs lie inside the data range of each correlation; boundary values count as inside.
Zukauskas bank heat transfer
| Check | Current | Valid range | Status |
|---|---|---|---|
| Re_D,max | 2,040 | 10 – 2×10⁶ | Within |
| Pr | 4.31 | 0.7 – 500 | Within |
| 10² ≤ Re < 10³ band | 2,040 | — | Within |
| Rows N_L | 20 | ≥ 20 | Within |
| S_T/S_L (in-line) | 1.00 | — | Within |
Gaddis–Gnielinski pressure drop
| Check | Current | Valid range | Status |
|---|---|---|---|
| Re₀ | 2,040 | 1 – 3×10⁵ | Within |
| a = S_T/D | 2.00 | 1.25 – 3 | Within |
| b = S_L/D | 2.00 | 0.6 – 3 | Within |
| c (staggered diagonal ratio) | 2.24 | ≥ 1.25 | Within |
| Main resistances N_W | 20 | ≥ 5 | Within |
| Low-Re laminar part | 2,040 | ≥ 1000 | Within |
1D pin conduction
| Check | Current | Valid range | Status |
|---|---|---|---|
| Bi = hD/(4k) | 0.0233 | ≤ 0.1 | Within |
Coolant property table
| Check | Current | Valid range | Status |
|---|---|---|---|
| Mean bulk temperature | 40.4 °C | 5 – 150 | Within |
| Mean wall temperature | 41.8 °C | 5 – 150 | Within |
| Base temperature | 43.1 °C | ≤ 100 | Within |
Geometry
| Check | Current | Valid range | Status |
|---|---|---|---|
| H/D | 4.00 | ≥ 4 | Within |